
Work / Helicopter pilot live map
Helicopter pilot live map
For SkyNav4's 2019 rebuild I wrote planned heights above ground, the tunnel view and progress along the line.
Re-creation. It was rebuilt after running the real SkyNav4 on public data, and it copies no code, screens or assets from it. The terrain is ARSO's 1 m LiDAR elevation model (CC BY 4.0). The roads, buildings and both transmission lines are © OpenStreetMap contributors (ODbL), and the flight lines and the flight are simulated.
What the real one does
The dynamic navigation system pilots fly inspection with. It shows the job's flight lines, with large instruments for speed, height above ground, distance from the line and progress along it. I wrote key features of its 2019 rebuild.
- The camera's overlap depends on speed, and the job sets a height above the terrain for every line. The pilot has to hold both while reading the screen in a vibrating cockpit.
- In the 2019 rebuild I added planned heights above ground along each flight line from a terrain model, the tunnel view and progress along the active line. I also split one large script into modules. Later I wrote the driver for a newer GNSS receiver, a tool to import layers from a server, and fixes for high-DPI screens.
How the demo works
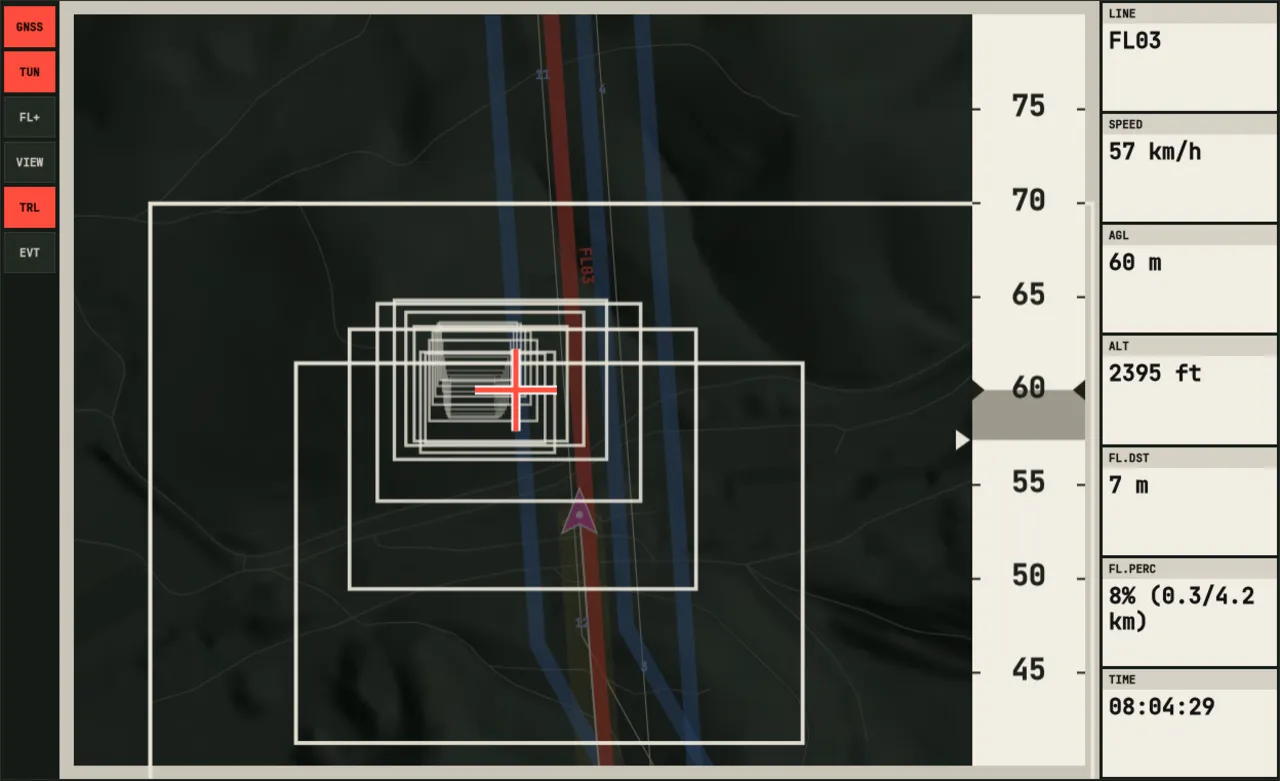
The pilots' moving map, with its tunnel view. Fly a line yourself, or let the autopilot do it.
The layout follows the real application. Tools are on the left and the map in the middle. The instruments on the right use type large enough to read in a vibrating cockpit. VIEW switches between the whole job, a heading-up map that follows the aircraft, and a north-up one.
Every flight line carries a planned height: the terrain under it plus the height above ground the job asks for, sampled densely along the line. The tunnel view uses those heights. It draws a box 40 m wide and 30 m tall around each point of the line ahead, in perspective, and the pilot keeps the cross inside them.
Speed matters as much as position, because the camera's overlap depends on it. The frame around the tunnel turns blue when the aircraft is more than 7 km/h slower than the line's target speed, and red when it is more than 3 km/h faster. The tape on the right shows the target.
To build this page, the real application was run locally on public data. It flew four flight lines near Senožeče over ARSO's terrain model, with an invented GNSS log played through its own simulator. What it showed was then redrawn here from scratch.