
Work / Wire and pylon vectorization from point cloud
Wire and pylon vectorization from point cloud
About 8,500 lines of my code find the wires in Panarch's LiDAR scans, one clean 3D line per conductor. My bachelor's thesis measures how far a tower leans, and it is still in production there.
Re-creation. The code on this page was written for it, not taken from the production tools. None of my employer's code or data is used. The data is public: Slovenian Environment Agency (ARSO), LiDAR point cloud GKOT, tile TM_426_66, survey 2014-2015, CC BY 4.0. That scan is too thin and one-sided to measure the tower's lean honestly. The tower demo's last step uses a simulated tower whose true lean is known instead.
What the real one does
From the LiDAR scans, my code draws one clean 3D line per conductor per span and measures how far a lattice tower leans. The wire part is about 10k lines of original code in the QGIS suite, written between 2018 and 2024. The tower part started as my bachelor's thesis in 2019 and is still in production today.
How the demo works
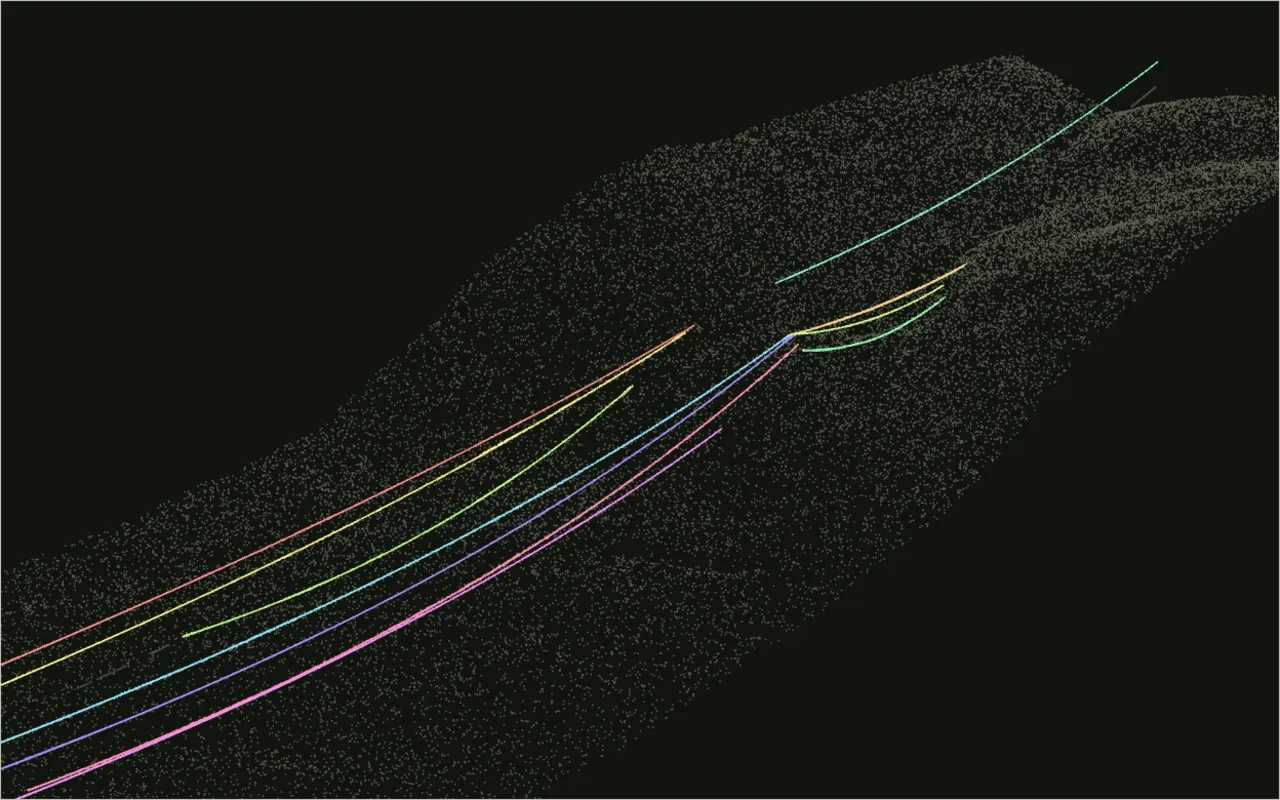
Wire points from a real transmission corridor become one clean line per conductor.
The corridor is the same one as in the point-cloud demo: two transmission lines near Senožeče, side by side.
A wire is easy to see and awkward to measure. Its points thin out over trees, the conductors on one tower hang only a few metres apart, and a first pass always gives you pieces. So the method here takes two steps.
In each span it picks three points many times over and fits a parabola along the line and a straight line in plan through them. It keeps the curve that most points agree with. Then it grows each curve over the full survey, taking every point within 50 cm of it, whatever class the survey gave that point. It refits until the curve stops changing.
On this tile that gives 11 conductors, most of them running from tower to tower, with fit errors of 10 to 25 cm. About 5 % of the points stay unassigned. Over a span this short a parabola is close enough to a hanging cable, while a production tool fits the catenary and joins spans across the towers.
Pylon verticality: how far a tower leans
My bachelor's thesis measured how far a lattice tower leans from LiDAR, and it is still in production at Panarch.
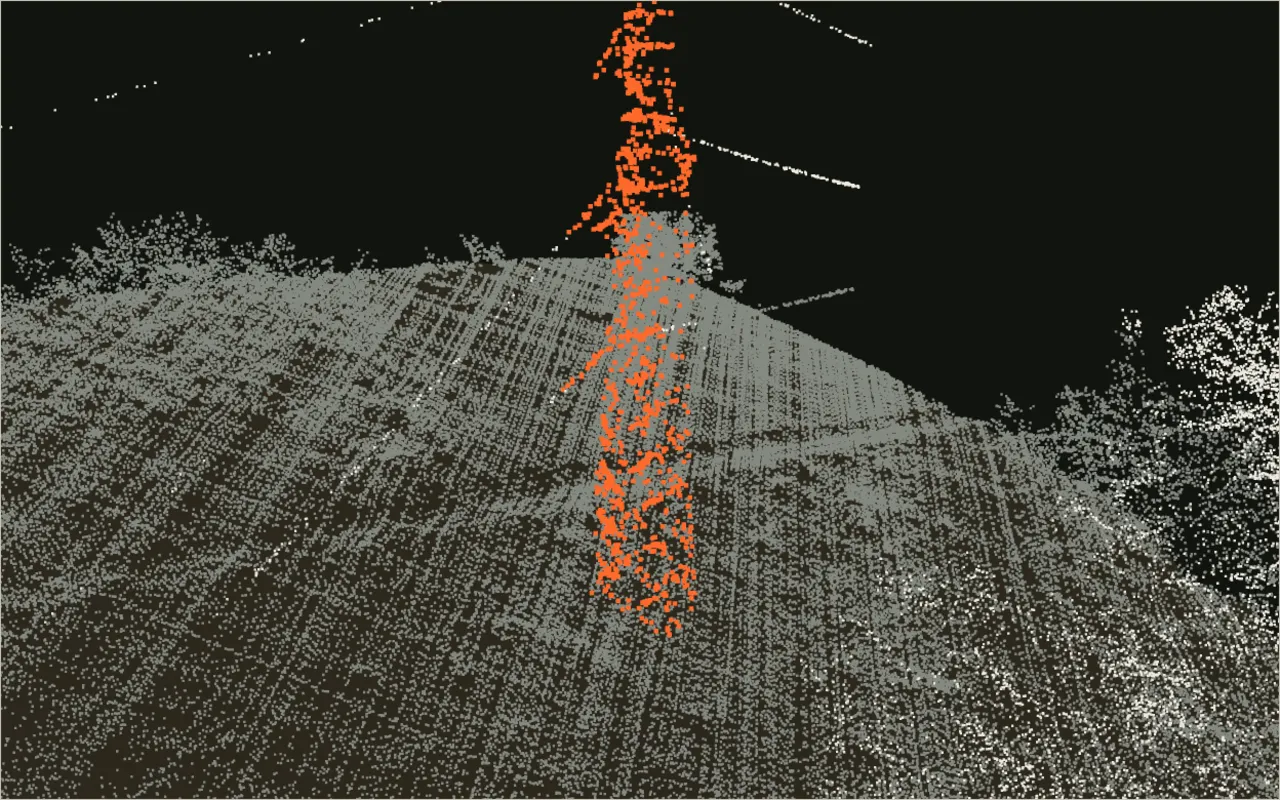
Start with a raw scan around a real tower. Find the ground and the height above it, cut out the tower, then measure its lean on a test bench.
Everything starts with the ground. Until you know where the ground is, a tree, a tower and a hillside are the same thing: points with a height. The filter here takes the lowest point in each 1 m cell, then opens that surface with windows of 3, 5, 9 and 17 m. Whatever sticks up more than the terrain's slope allows is not ground. It runs in your browser in a fraction of a second, and it agrees closely with the ground class the survey shipped with.
Once the ground is known, height above ground separates everything else: low vegetation, trees, wires and the tower. The tower is then a column of points more than 2 m up at the tower's position.
A lattice tower is symmetric, so the middle of its legs at any height lies on its axis. Cut the body into 1 m slices, take the middle of each slice's footprint between the 5th and 95th percentiles, and fit a straight line through those middles. The angle to the vertical is the lean. The test bench shows how the estimate degrades. Lower density or more noise costs a little, and a scanner that sees only one side costs a lot.